A technical analysis example helps those new to investment and the use of this method to understand how it works. Investors who use technical analysis use charts to identify where to buy and where to sell a stock or Exchange Traded Fund (ETF). They look for peaks, bottoms, trends, patterns,, and other factors that provide insight into a stock's potential movement. There are … [Read more...] about Technical Analysis Example
Technical Analysis Frequently Asked Questions
Can the market maker see a trailing stop order? The market maker can see all orders that are outstanding, including trailing stops. Your broker, either a person of the online system, enters the order into the trading system where the stock is traded. If your stock has a market maker, he/she can see all orders. While they are not supposed to do this, often, the market maker … [Read more...] about Technical Analysis Frequently Asked Questions
Symmetrical Triangles Stock Chart Pattern
Symmetrical triangles are one of the most popular stock chart formations employed by investors who follow technical analysis. With their very low failure rate, symmetrical triangles offer you an extra edge to help beat the market. Be sure to add symmetrical triangle patterns to your technical analysis tool bag. Symmetrical Triangle Chart Pattern A symmetrical triangle can … [Read more...] about Symmetrical Triangles Stock Chart Pattern
S&P 500 Index Trend Charts
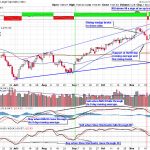
Another day of trading sideways as the market moved down on below-average volume. Resistance remains at the 930 level, and support is holding at 875. We could continue this for several more days or even weeks. The 800 level is approximately a 50% retracement of the recent rally, which could be a logical target should we see a move down. After that, we will have to … [Read more...] about S&P 500 Index Trend Charts
Pull Back or New Bear Market
In June 2006, the market fall had many worried. Is it just a pullback and the cyclical bull market will resume soon or is this a new cyclical bear market? According to many pundits, if the market pulls back 10-15%, it is a pullback. If the market falls 20% or more, then we have entered a new Bear Market. Well, let's look a little more closely into this potential change in … [Read more...] about Pull Back or New Bear Market