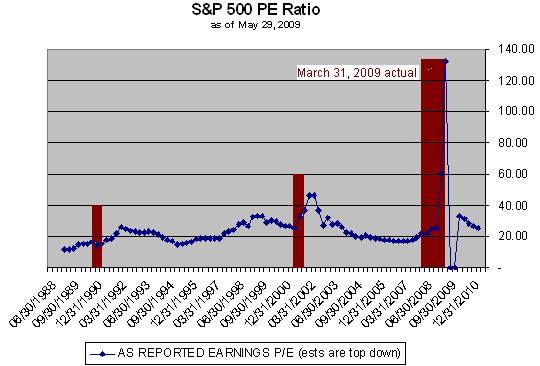

In February 2009, I asked the question in an article on the same subject, is the current S&P 500 PE ratio trending down or up? If you are like most investors, then you believe the S&P 500 PE ratio is trending down as the stock market plunges. After all, the P, or price part of the ratio was falling.
The answer: the S&P 500 PE ratio was trending up. After the
earnings result for the quarter ending
With 99% of all S&P 500 companies reporting, the as reported earnings for the March quarter is $7.61 according to Standard & Poor’s. As shown on the chart below the S&P 500 PE ratio has risen to 132 for the quarter ending March 2009. According to Standard & Poor’s estimates for the June and September 2009 quarters are 3,500 and -301 respectively. These two values reflect the serious losses incurred in December 2008 combined with the anemic earnings performance since then. I removed these numbers from the chart as they skewed the chart significantly.

It is interesting to note that the forecast for the S&P 500
Index PE ratio rises so much in 2010. This is driven by two factors. First,
Standard & Poor’s forecasts $34.61 earnings for 2010. This is the lowest since
the early 1990’s when the S&P traded in the 400 to 600 range. Second, to
calculate the PE ratio, Standard & Poor’s uses the most recent closing price for
the index, which was 919.14 on
As we have seen, PE ratios often rise sharply following a recession. Several quarters after the recession is over, the PE ratio then turns back down, reflecting the rise in earnings, with the price either remaining constant or continuing to fall.
Yale University Professor Robert J. Shiller, author of
Irrational Exuberance: Second Edition
![]() uses a modified PE ratio that smoothes out the volatility in the ratio. The
denominator of this modified ratio is average inflation-adjusted earnings
over the trailing 10 years. Shiller calls this modified ratio "p/e10." Using
this data the modified ratio “p/e10” produces a PE ratio of slightly over 15,
which is very close to the median of 15.7. In December 2007, the beginning of
the current recession, the “p/e 10” was 25.95. Since markets tend to cycle above
and below the median, we should expect the “p/e 10” to fall further before
turning back up.
uses a modified PE ratio that smoothes out the volatility in the ratio. The
denominator of this modified ratio is average inflation-adjusted earnings
over the trailing 10 years. Shiller calls this modified ratio "p/e10." Using
this data the modified ratio “p/e10” produces a PE ratio of slightly over 15,
which is very close to the median of 15.7. In December 2007, the beginning of
the current recession, the “p/e 10” was 25.95. Since markets tend to cycle above
and below the median, we should expect the “p/e 10” to fall further before
turning back up.
The
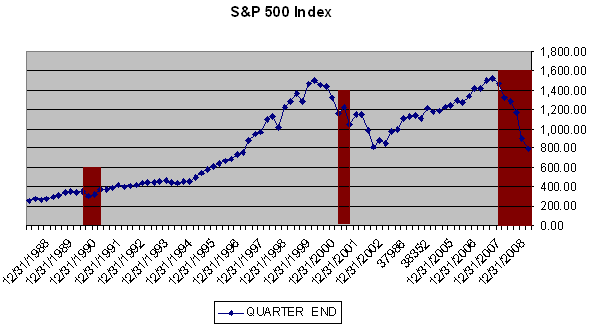
Does this mean the market is going lower? Not necessarily. As shown in the chart below of the S&P 500 index, the index continued to retreat after the 2001 recession. On the other hand after the recession of 1990 – 1991, the S&P 500 rose slowly. Besides, we do not know when the current recession will end.

Looking at the earnings forecast from Standard & Poor’s we might be able to assess which way the S&P 500 will likely move. The table below uses the trailing four-quarter earnings from Standard & Poor’s. It then applies a PE ratio to derive the S&P 500 index. When looking at the table, keep in mind that the median PE ratio is 15.7. The PE ratio is mean reverting, so we should expect it to fall further, possibly to 10. In addition the very low S&P Trailing Earnings for June and September 2009 are due to the large loss reported in December 2008 quarter.
|
S&P 500 based on Estimated Earnings |
||||||||
|
|
S&P Trailing |
PE Ratio |
||||||
|
Quarter |
Earnings |
10 |
12 |
15 |
17 |
20 |
25 |
30 |
|
|
$35.67 |
357 |
428 |
535 |
606 |
713 |
892 |
1,070 |
|
|
$34.61 |
346 |
415 |
519 |
588 |
692 |
865 |
1,038 |
|
|
$32.32 |
323 |
388 |
485 |
549 |
646 |
808 |
970 |
|
|
$29.48 |
295 |
354 |
442 |
501 |
590 |
737 |
884 |
|
|
$27.47 |
275 |
330 |
412 |
467 |
549 |
687 |
824 |
|
|
-$3.05 |
(30) |
(37) |
(46) |
(52) |
(61) |
(76) |
(91) |
|
|
$0.26 |
3 |
3 |
4 |
4 |
5 |
7 |
8
|
The low earnings for June and December 2009 are the reason Standard & Poor’s reports the skewed PE ratio of greater than 3,500 for June 2009 and -301 for September 2009.
Using the December 2009 quarter the earnings forecast
$27.47 and a PE ratio of 30 gives us a target price for the S&P 500 index of
824. On
This examination of earnings and PE ratios is telling us to expect a lower S&P 500 index throughout 2009. How far it will go down depends on several factors. First, are the earnings forecast correct? Investors should monitor earnings expectations throughout the year, looking for any changes either up or down. In February 2009, Standards & Poor’s estimated that the trailing earnings would be $13.47 vs. the current estimate of $27.47. In February 2009, the estimate for the trailing four-quarter earnings was $32.41 vs. $29.48 now. The estimates for all of 2010 are lower now than they were in February, indicating S&P is not expecting a robust recovery.
Second, evaluate your PE assumptions based on the outlook for the economy and the markets. If earnings are running above the forecast from Standard & Poor’s, then you should expect the PE ratio to rise eventually. On the other hand, if earnings expectations are falling, then you should expect the PE ratio to fall further. In each case, any move in the PE ratio will tend to move more slowly. The median S&P PE ratio is 15.7. Using December 2009 trailing four-quarter earnings of $27.46 times the median PE ratio of 15.7 gives us an S&P price of 431.
It is difficult to justify an S&P 500 PE ratio of greater than 30 when the economy is still in a recession and the recovery is likely to be at a slower pace than in the past. This will put downward pressure on the S&P 500 for the rest of 2009 and 2010.
As investors, we should assume that the trend for the S&P 500 is still down. It will be important to monitor the performance of the S&P 500 companies earnings announcements during the next several quarters to see how they match up to the forecast.
Our Premium Members receive weekly updates on important and relevant trends for the stock market, industry sectors and individual stocks and ETFs. By following the trends and using fundamental analysis, we have beat the market every year since our inception. You should give our four-week free trial to the Premium Membership a try. There is no risk, nor any obligation. If you have any questions regarding membership, please send an email to [email protected] and we will get right back to you. Your complete satisfaction is of utmost importance to us.