
November 9, 2011, 5:00pm ET
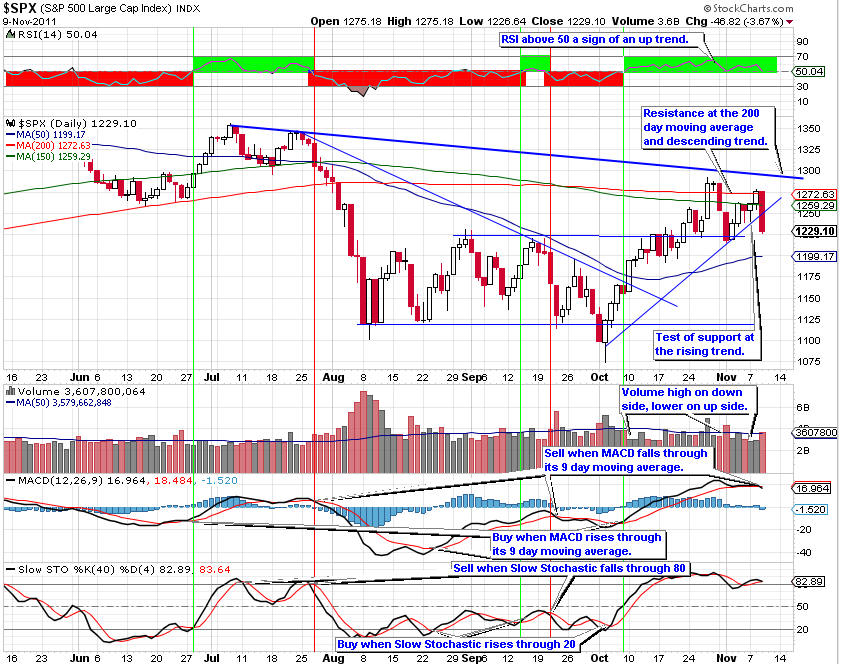
The S&P 500 stopped at resistance at the 200-day moving average as volume was slightly above average on the move down today. The 1,225 area offers some resistance.
The short-term indicators tell us to expect a move down.
The market is at an important transition stage. If it can regain the upward momentum the rally will continue. On the other hand, if the down trend resumes, the market will fall.
Today, the S&P 500 encountered resistance at the 200-day moving average, turning down. Volume today just above average and higher than on the recent moves up. As long as volume on the moves down is above the volume on the up moves, the market will trend down.
A break through this resistance level on above average volume would be a buy sign. If this resistance holds, we should expect another test of support at the 1,125 area.
For now, the resistance remains in control.
The RSI is above 50 a sign of an up trend.
After falling through its 9-day moving average, the MACD gave a sell sign.
The Slow Stochastic is above 80 where it will turn down, giving a sell sign soon.
The slope of the 150-day moving average is negative, indicating the S&P 500 is in a down trend longer-term. If the 150-day moving average does not turn up soon, the longer term trend is down. This warrants watching over the next couple of weeks.
Link to current version of the chart prices: S&P 500 6-month chart.
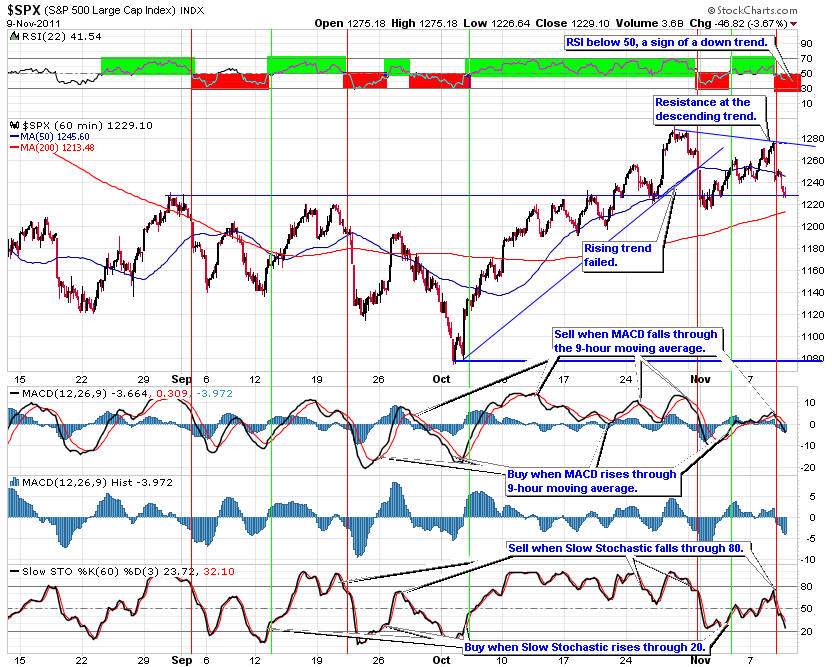
On the 60-minute chart, the S&P 500 turned down before reaching the recent high, forming a descending trend. A test of the 1,225 level is under way. If this level fails to hold as support the market will continue to trend down.
The RSI is below 50 a sign of a down trend.
As expected the MACD fell through its 9-day moving average, giving a sell signal.
The Slow Stochastic fell through 80 giving a sell sign.
The indicators are telling us we are more likely to see a move down in the near-term.
Link to current version of 60-minute S&P 500 chart, requires a subscription to stockcharts.com basic service. Trading Online Markets LLC does not receive any compensation from stockcharts.com.
The dollar rebounded up from support of the 200-day moving average.
Investors still recognize that U.S. economy is in slow growth mode and little is being done to correct the growing debt. Worries over the debt crisis in the United States and Europe are giving investors fits over where to place their money.
Any rise in the dollar will cause commodities to fall in dollar terms taking with them the materials sector and energy companies.
The RSI is above 50 a sign of an up trend.
The MACD rose through its 9-day moving average giving a buy sign.
The Slow Stochastic rose through 80 giving a buy sign.
The direction of the dollar will inversely dictate the price of commodities. If the dollar falls the price of commodities will rise taking with them the materials stocks.
Longer term the dollar will continue to trend down as the growing U.S. debt becomes more unmanageable. In addition, a falling dollar is a way to reduce the cost of the debt of the U.S. held by foreign entities.
.jpg)
If you are interested in a free monthly newsletter on the stock market trends, please send an email to [email protected] with your email address stating you wish to receive the Free Monthly Newsletter and you will be added to the list.