Is the likelihood of a recession increasing? If you hope to beat the market or want to learn to invest, then it is important to pay attention to what the market is telling us.
Jonathon H. Wright, an economist at the Federal Reserve Board has updated the work of Federal Reserve economists Mishkin and Estrelia regarding the Inverted Yield Curve. As many of you may recall I wrote about the inverted yield curve several times in the 2006, mentioning the study by these two economists. You can read Wright’s original study at http://www.federalreserve.gov/pubs/feds/2006/200607/200607abs.html.
Briefly, these economists discuss the probability of a recession following an inverted yield curve. They found that the "the spread between the interest rates on the ten-year Treasury note and the three-month Treasury bill--is a valuable forecasting tool." This paper is available at http://www.newyorkfed.org/research/current_issues/ci2-7.pdf. The 1996 study (and previous research by Dr. Campbell Harvey) showed that there is a strong connection between an inverted yield curve and a recession four quarters later.
Wright not only updates the previous work, but he suggests that we should consider the absolute level of the Fed funds rate as well. He uses another model, using the concept of spread on the yield curve, to provide an improved predictive performance. His recent performance suggests a less chance of a recession in 2007 than the previous Fed studies on the yield curve.
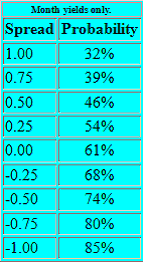
There are two stages to Wrights model. The first looks at the probabilities of a recession using just the term spread on the yield curve. Today, we have a negative yield spread of about 50 basis points (using the 90 day average as Wright uses in his study). As shown in the table below this gives us a 74% probability of a recession. This is kind of scary. Thanks to Dr. James Hamilton, UC San Diego for the charts and graphs available through his blog at Econbrowser.com.

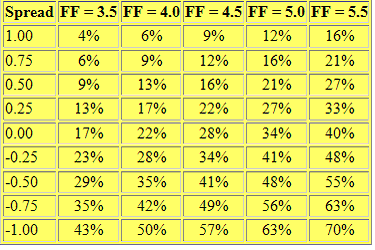
In a research paper published by Wright and Andrew Ang, Monika Piazessi and Min Wei in the Journal of Econometrics suggest that it is helpful to look at the overall level of short term interest rates to the spread based model. According to this second model, the low values for the spread we have recently seen are not a source of concern for future economic activity since the Fed funds rate is so low by historical standards.
The spread is the difference between the 3-month T-bill rate and the 10-year bond. Today that is a around a negative 50 basis points or -0.50. Each column to the left is for a different level of Fed funds rate. Thus FF=4.0 is a Fed funds rate of 4%. There is no column for 5.25%, where we are today, but there are columns for 5% and 5.5%.

If you go to a clever web site at www.politicalcalculations.blogspot.com, you can actually calculate the odds of a recession yourself, using current numbers. http://politicalcalculations.blogspot.com/2006/04/reckoning-odds-of-recession.html
Now they don't tell you, but you will need to use the 90-day average for the 3-month, 10-year, and feds fund rates if you are going to duplicate Wright's research. And what you find is that you get a 51.9% chance of a recession, substantially less than the 74% suggested by using the term spread alone. This is where I get the 50-50 odds of a recession in 2007.
So what does this mean for policy? If you raise the Fed funds rate another 25 basis points to 5.5%, I think it would clearly also increase the negative slope of the yield curve by at least another 25 basis points. That would put the odds of a recession closer to 63%.
It is possible that this research played a role in fed Chairman Ben Bernake’s assessment that:
I would not interpret the currently very flat yield curve as indicating a significant economic slowdown to come, for several reasons. First, in previous episodes when an inverted yield curve was followed by recession, the level of interest rates was quite high, consistent with considerable financial restraint. This time, both short- and long-term interest rates--in nominal and real terms--are relatively low by historical standards.
So where are we on the inflation front, as that will tell us more about the likelihood of a rise or fall in short term rates?
Currently, the core inflation rate is running at 2.7% over the last 12 months, up slightly in the last month. Unit labor costs, an important component of core inflations, are rising at more than 3%. We also are experiencing low unemployment, which adds to the wage inflation pressure.
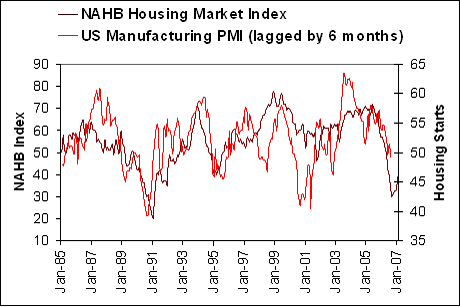
The US economy is still strong. Look at the charts below to get an additional perspective. The first is the relationship between manufacturing and the housing market. It seems to say that manufacturing still has some more room to go down in the next few quarters.

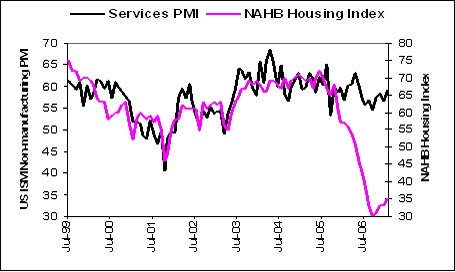
Next we show how the services sector compares to the housing index. It shows that service sector is still doing well and even rising a little.

When looking at these two charts keep in mind that manufacturing is 23% of the US economy and services is 77%. If the US is to go into a recession it will take a much bigger drop in manufacturing or services will have to turn down soon.
With the risk of inflation still on the Fed’s mind and the probability of a recession at 50%, they are not likely to cut rates any time soon. From an economic standpoint, I do not look for a rate cut at the next two Fed meetings on March 20-21 and May 9. We will need to monitor the direction inflation moves over the next several months to get a better perspective on what the Fed might do in June or later.
The weakness in housing and now sub-prime mortgage market will place further downward pressure on the economy and tighten up loan covenants. This will be good longer term. Whether it will drive the US economy into a recession or just cause a slow down is difficult to tell. It might the driver to lower inflation in the future, so the Fed will not have to raise rates. Something to keep an eye on.
We also need to be careful in our stock selection and place our stops to protect our hard earned capital. During these times it is imperative to select quality companies that are temporarily experiencing lower stock prices, using our stock watch list in our Premium Portfolios.
If you wish to learn more about the stock market and how you can consistently make money, I encourage you to try our four-week free trial subscription to our Premium Pages. There is no risk and no obligation. Moreover, we have beat the market every year since our inception on January 2006 and we continue to do so now.