
When analyzing monthly stock market trends, I use the S&P 500 charts to identify important trend lines. Trend following is a proven strategy to beat the market and grow your stock portfolio. Technical analysis provides the tools to analyze and identify trends in the stock market. Since the S&P 500 chart is the one used by professional traders for their analysis, it is important to understand how it is performing.
The analysis of the S&P 500 trend line starts with the 20-year monthly view of the S&P 500 chart. Next, we examine the weekly chart of the S&P 500 trends to get a shorter-term view. Finally, we analyze the one-year daily chart of the S&P 500 trends to get an even shorter-term view. On each version of the charts of the S&P 500 trend line, the view and the value of the indicators change, as we move from a monthly to a weekly and then a daily chart.
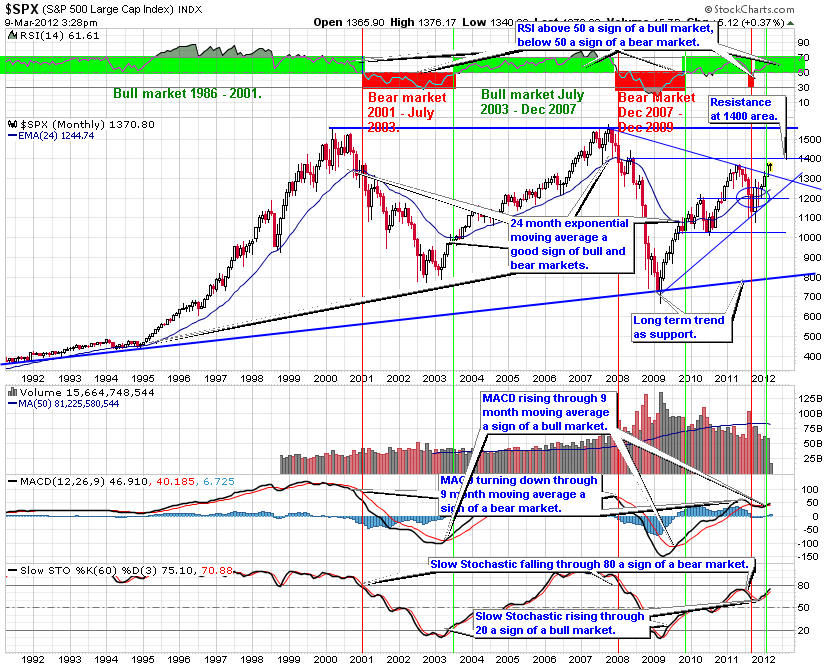
Starting with the monthly view of the S&P 500 trend chart, the bull market of the last five years turned down, as the index fell below the 24-month exponential moving average. The Relative Strength Indicator (RSI) is below 50, indicating a downtrend is in place. The Moving Average Convergence Divergence (MACD) fell below zero, a sign stock market trend has reversed and we have entered a bear market. Finally, the Slow Stochastic fell through zero, another sign of a bear market.
The analysis of the monthly trends of the S&P 500 chart shows we remain in a bear market with key resistance at the 24-month exponential moving average. In addition, support at the 25 year rising S&P 500 trend line has been tested and held, so far. However, the Slow Stochastic rose through the 20 level. If it is able to stay above 20, it is an early buy sign. The MACD is very close to giving an end of the bear market signal. September will be an important month. From the monthly view, we remain in a bear market though we could be at a transition point if September continues the rally.
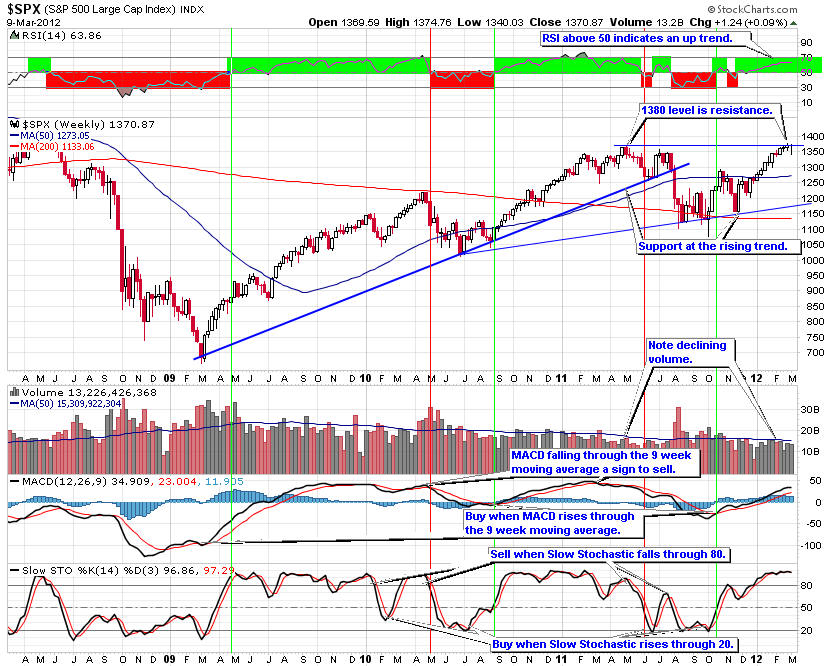
The four-year weekly S&P 500 trend chart shows more closely the transition from a bull to a bear stock market. So far, the descending trend is the primary resistance level for this view of the bear market.
Earlier this year the S&P 500 fell through support at the 800 level down to the 650 area. The S&P 500 trend then reversed course, generating a nice rally pushing through resistance at the 930 and 970 levels.
As the rally continued it reached my target of 1,205 where it seems to have stalled. The 1,025 target was provided to our Premium members in July 2009.
RSI is above 50, a sign of an up trend. The MACD continues top rise indicating the weekly view is still strong. Earlier the MACD showed positive divergence indicating the uptrend would begin in early March. Slow Stochastic remains above 80, though it is poised to turn down. When it does it will give a sell sign.
The weekly chart pattern indicates the S&P 500 trend remains intact. Support remains at the rising trend, though the slope is steep and unsustainable. The rally can continue for a while longer, though we should expect a pull back at some time in the next several weeks up to early October.
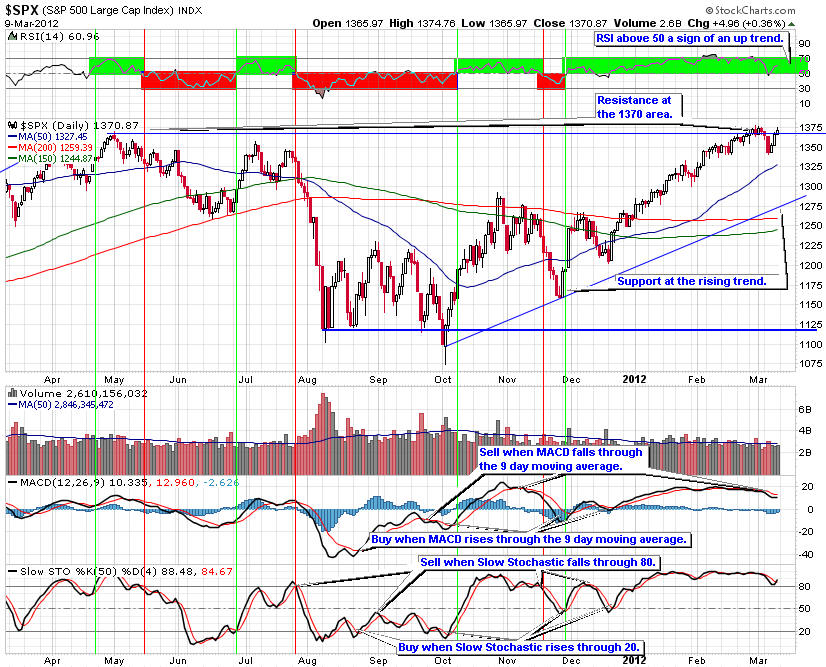
The daily S&P 500 shows the rise to just above the 1,000 level at my target of 1,205. Average volume has been declining, though it is summer, when trading volume tends to decline.
RSI is above 50 indicating an up trend. The MACD turned down at 9-day moving average, a sell sign. The Slow Stochastic is above 80, where it will eventually turn down, giving a sell sign.
The daily chart of the S&P 500 is telling us the rally is encountering resistance and could be turning down. The indicators are telling us the current high levels could be at risk of a down turn and caution is warranted.
In addition, we are entering the two historically weak months of September and October, when the market has moved down the most. this combined with the warning in the charts, is telling us to take steps to add further down side protection, such as closing part of your longs positions, buy protective put options and sell covered calls. you might even consider buying one or more of the ETFs that short the market.
Given this analysis of the S&P 500 trend line charts, it is important to have your portfolio positioned for a move down that might begin later in September. If we do get a move down it will be important to look for the bottom as it should offer a good place to add to long positions.
The charts of the S&P 500 trend lines provide a good way for investors to align their portfolios with the overall market trends. Bear market rallies offer investors a good time to buy stocks and ETFs in leading sectors. Look to buy on dips in the price of the S&P 500 trend charts on the next pull back. Be sure to use proper capital management techniques including trailing stops, protective put, covered call options and position sizing. When the pull back ends, look to add to long positions with stocks and ETFs from the sectors that are likely to outperform the overall market. Keep in mind, Warren Buffett's first rule of investing is to not lose money. Be patient waiting for good entry points.
Our Premium Members receive weekly analysis of market trends of all major indexes and industry sectors. They also receive frequent updates when conditions warrant, so they are prepared to trade and invest with the trend. Moreover, our stock and sector portfolios have beat the market every year since our inception in 2005. For 2009, our stock portfolio is up over 14% for the year.
Try the free four week subscription to our Premium Members pages and receive:
If you decide to continue at the end of the four-week trial your subscription starts automatically. If you decide to cancel before the end of the trial, you will not be charged a thing. No risk, no obligation.
Give the Premium Membership a try. You have nothing to lose and a lot to gain and we have beat the market every year since our inception.