
The S&P 500 is trying to push through resistance at the 1,220 area. If it succeeds the 1,300 is the next resistance level.
The index indicators are telling us to be careful as they are at high points indicating the market could turn down. However, a breakout is still possible as the indicators can remain at high levels for many weeks.
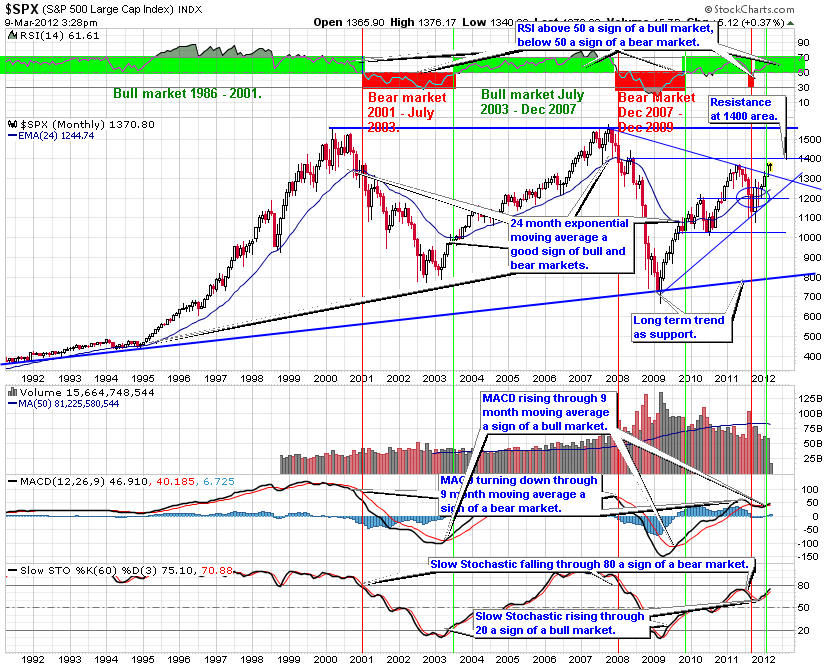
Starting with the indexes gives an overall perspective to the markets. This is monthly chart for the S&P 500 showing 20 years of performance. Since this index is the one used by professional traders it is important to understand how it is performing. This chart is also excellent at defining the longer term trends for the market.
The bull market of the last five years broke down when the S&P 500 turned down through the 24 month exponential moving average. The bear market began when the index fell through the 24-month exponential moving average. Also, the RSI tested the 50 level, another important indicator of bear markets (if the RSI remains below 50 then we are in a bear market) and turned back down. The MACD crossing down through zero is another sign of the transition from bear market to bull market. Finally, the Slow Stochastic fell through 80 as another sign of the beginning of the bear market.
The 24-month EMA has held as support indicating the market will continue to trend upward. Should the 24-month EMA fail on a pull back it might be time to reconsider. For now assume the trend is up.
For November 2010, the S&P 500 closed below the recent closing high in April 2010. So far in December the S&P 500 is trying to push up through this level. If it closes above the April high by the end of December, we have a good signal the rally is resuming.
The RSI is above 50 level a sign of a bull market. The MACD is rising through the zero level, a good sign for the S&P 500. If the MACD turns down through its 9-month moving average it will be a sell sign.
The Slow Stochastic turned back up at the 50 level, indicating the market continues to rise.
From a monthly chart perspective the rally is continuing. If the close is above 1,200 we have a good indication the rally will continue. On the other hand, if the close is below 1,200, the market is more likely to trend down.
You can click on the link below to see a current version of this chart.
You can click on the link below to see a current version of this chart.
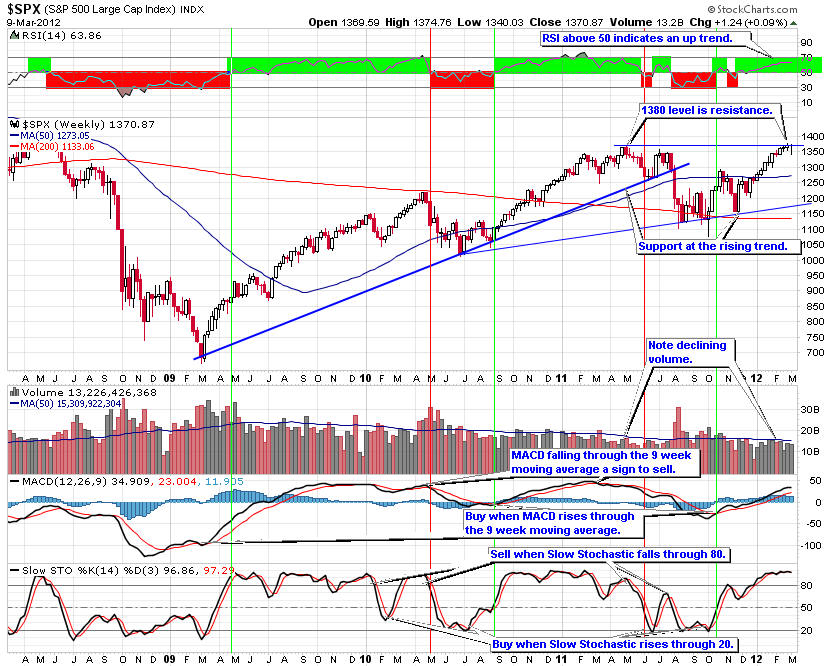
The four-year weekly S&P 500 trend chart shows the formation of an ascending triangle, a bullish formation. The price is breaking out through resistance at the 200-week moving average and the 1,220 area. The next resistance level is 1,300. The rising trend offers support.
RSI is above 50 a sign of an up trend. The MACD is trending up a positive sign for the market. The Slow Stochastic is above 80 where it will turn down giving a sell sign eventually.
The ascending triangle suggests that the market may turn down just above the 1,200 area,. If it does, look to buy shares at the support of the rising trend, if it holds.
Should the S&P 500 break out through the resistance of the 200-week moving average and at the 1,220 area with above average volume, it is a good sign the rally will continue. Look to buy quality stocks that will benefit from the quantitative easing from the Federal Reserve.
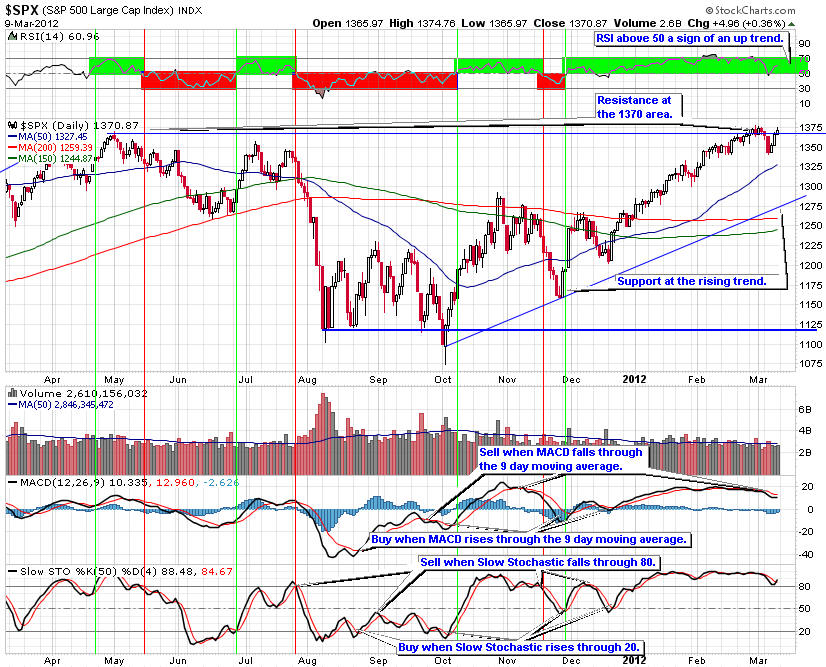
The price is testing resistance at the 1,220 area. Should the price break through, it is a sign the rally is resuming. On the other hand if the price falls from here, the market is once again subject to a new down trend.
RSI is above 50 a sign of an up trend. The MACD is turning up through its 9-day moving average, giving a buy sign. The Slow Stochastic turned back up through 80 negating the earlier sell sign.
The slope of the 150-day moving average is another important indicator. When it slopes up it is telling us the trend is up. When it points down the trend is down.
The slope of the 150-day moving average remains positive, a sign of an up trend.
As expected we are seeing another attempt to rise through resistance at the 1,220 level. This is an important test on the trend for the next several of months.
You can link to a current version of this chart below.
Given this analysis of the S&P 500 trend line charts, it is important to position your portfolio for a market that is more likely to trend in a range with cyclical rallies and pull backs.
Selecting the right sectors and stock picking will become more important to your success. Look to buy on dips in the market to important support levels. Then add down side protection at interim high points using trailing stops and protective put options to help improve the overall return.
The charts of the S&P 500 trend lines provide a good way for investors to align their portfolios with the overall market trends. Picking the right sectors and stocks will become even more important. Look to buy on dips in the price of the S&P 500 trend charts on the next pull back.
Be sure to use proper capital management techniques including trailing stops, protective put, covered call options and position sizing. When the pull back ends, look to add to long positions with stocks and ETFs from the sectors that are likely to outperform the overall market. Keep in mind, Warren Buffett's first rule of investing is to not lose money. Be patient waiting for good entry points.
As of the end of November 2010, our Stock Portfolio was up 19.1 percent and our sector portfolio was up 15.7 percent. The market as measured by the S&P 500 was up 5.8% for 2010.
Request a Premier membership with a free four week trial subscription with no risk or obligation.
If you decide to continue at the end of the four-week trial your subscription starts automatically. If you decide to cancel before the end of the trial, you will not be charged a thing. No risk, no obligation.
You have nothing to lose and a lot to gain, as we have beat the market every year since our inception.
If you are interested in a free monthly newsletter on the stock market trends, please send an email to [email protected] with your email address stating you wish to receive the Free Monthly Newsletter and you will be added to the list.