
The market indexes are testing important support levels during this correction. If these support levels fail, the correction will continue.
The weakness in the economy is creating a growing concern among many investors that another recession might be near. As mentioned to my Premier members, this is part of the long-term sideways movement in the markets that we must expect. significant economic growth will not take place for some time.
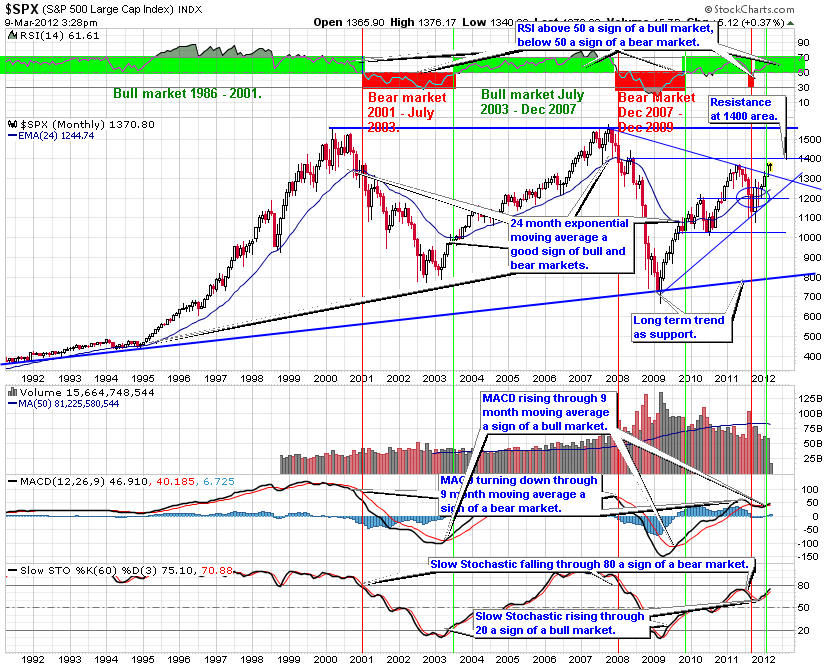
This is a monthly chart for the S&P 500 showing 20 years of performance. Since this index is the one used by professional traders, it is important to understand how it is performing. This chart is also excellent at defining the longer term trends for the market.
The end of the bear market and the stock market bottom came at the long term rising trend. Shortly after the monthly Slow Stochastic rose through 20 then the MACD rose through its 9-month moving average. Finally, the RSI climbed through the 50 level, though it is testing this bull-bear market indicator now. Most recently, the S&P 500 crossed through the 24-month exponential moving average. As long as it remains above this level, a bull market is in place.
In June 2010, the market fell through the 24-month exponential moving average. This week the index closed below the 24-month EMA, indicating the rally is over and a new move down is possible.
Presently, the RSI is above 50 a sign of an up trend.
The MACD is trending up. If the MACD turns down through its 9-month moving average it will be a sell sign.
The Slow Stochastic is might be turning down before reaching 80, a sign of weakness in the market.
From a monthly chart perspective the rally is faltering. Any further move down from here will indicate a new bear market is beginning.
For now, I intend to invest as though we are in a market that trends sideways in a wide channel in a trading range (1,400 - 1,200) that will be the dominate pattern for 2011. This will give us opportunities to buy at low points and sell at high points, meaning we will be trading more this year.
You can click on this Big Picture S&P 500 link below to see a current version of this chart.
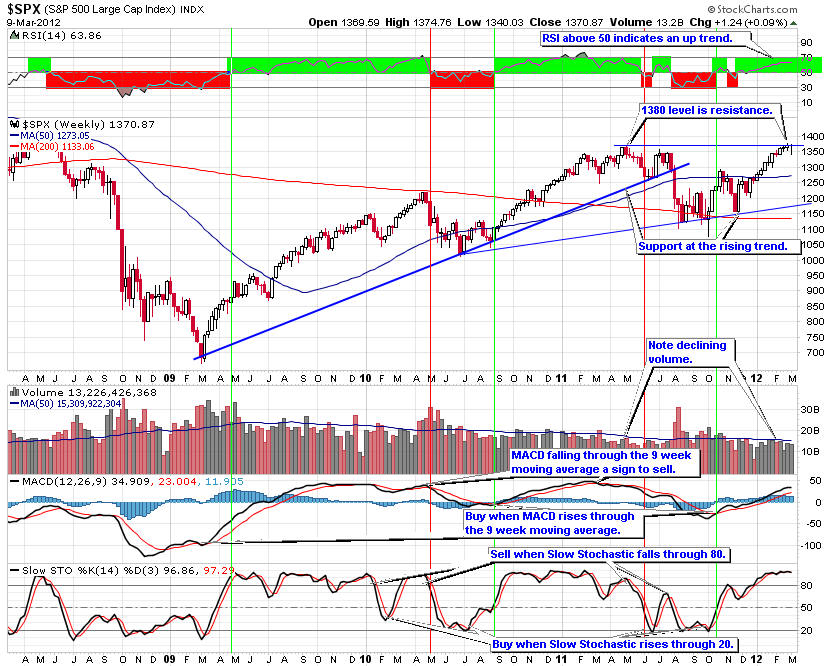
The four-year weekly S&P 500 trend chart shows the rebound from support of the rising trend; a trend that began in March 2010. Recent volume has been at or below average, a sign many investors are not participating.
As expected last month, the test of the 1,360 area held and the market turned down. A test of support at the rising trend and the 50-week moving average is underway. If these levels fail, the next support level is the 1,200 area.
RSI is below 50, a sign of a down trend.
The MACD has reached a high point where it turned down through the 9-week moving average, giving a sell sign.
The Slow Stochastic turned down before reaching 80, a sign of weakness.
The weekly chart pattern indicates the S&P 500 is turning down. If support at the rising trend fails, expect the market to trend down over the intermediate term.
You can click on this S&P 500 Weekly Chart link below to see a current version of this chart.
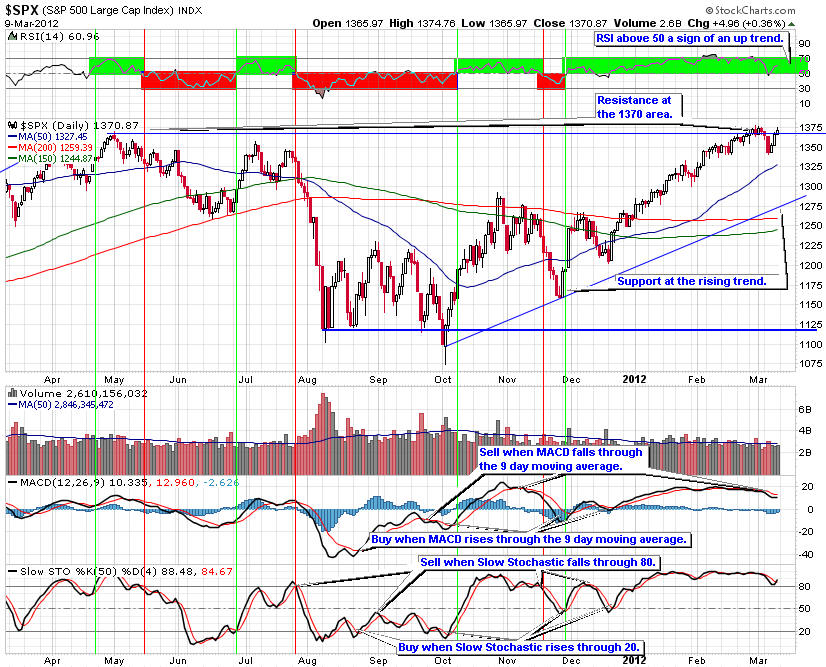
The S&P demonstrates a useful learning pattern. The attempt to push up through the resistance at the 1,350 area in the middle of May failed, a sign of a new move down. This move up formed a lower high another indication the market was about to fall further.
Initially, the 200-day moving average held as support telling us the market would rally. When the third attempt to rise through resistance at the 1,350 area failed, we received another indication the market would fall. The close below the 200-day moving average is another sign the market is trending down.
These are excellent chart patterns that help identify the market trend.
Now to the present. The S&P 500 is testing support at the 1,260 area. Most likely we will see a rebound here, though it will not last long.
Volume has picked up recently as the market moved down, telling us many traders are closing their psoitions.
RSI is below 50 a sign of a down trend.
As expected the MACD fell though its 9-day moving average giving a sell sign.
The Slow Stochastic turned down after clearing 80, giving another sell sign.
The slope of the 150-day moving average is another important indicator. When it slopes up it is telling us the trend is up. when it points down the trend is down. Until the last few days the slope of the 150-day moving average was up. Now it is flat. If the market remains below the 150-day moving average, this indicator will turn down telling us the market is in an intermediate down trend.
A head and shoulders pattern has formed, a bearish formation. If the index falls through the 1,025 level look for a drop to the 900 level based on the measure rule.
The test of the 1,260 area will be an important test.
For 2011, I am expecting the market to trade in a range 1,400 area as the high 1,200 as the low.
This link S&P 500 Daily Chart will give you a current perspective on the S&P 500.
Given this analysis of the S&P 500 trend line charts, it is important to position your portfolio for a market that is more likely to trend in a range with cyclical rallies and pull backs.
Selecting the right sectors and stock picking will become more important to your success. Look to buy on dips in the market to important support levels. Then add down side protection at interim high points using trailing stops and protective put options to help improve the overall return.
The charts of the S&P 500 trend lines provide a good way for investors to align their portfolios with the overall market trends. Picking the right sectors and stocks will become even more important. Look to buy on dips in the price of the S&P 500 trend charts on the next pull back.
Be sure to use proper capital management techniques including trailing stops, protective put, covered call options and position sizing. When the pull back ends, look to add to long positions with stocks and ETFs from the sectors that are likely to outperform the overall market. Keep in mind, Warren Buffett's first rule of investing is to not lose money. Be patient waiting for good entry points.
As of the end of July 2010, our Stock Portfolio was up 12.3 percent and our sector portfolio was up 5.4 percent. The market as measured by the S&P 500 was essentially flat.
Request a membership with a free one month trial subscription with no risk or obligation.
If you decide to continue at the end of the month long trial, your subscription starts automatically. If you decide to cancel before the end of the trial, you will not be charged a thing. No risk, no obligation.
You have nothing to lose and a lot to gain as we have beat the market every year since our inception.
If you are interested in a free monthly newsletter on the stock market trends, please send an email to [email protected] with your email address stating you wish to receive the Free Monthly Newsletter and you will be added to the list.