
Generally, I believe it is best to begin with the big picture in mind and then work our way down to weekly and then daily views of the charts. You will notice that the chart and the value of the indicators change as we move from a monthly to a weekly and then a daily chart. This is a normal part of the technical analysis.
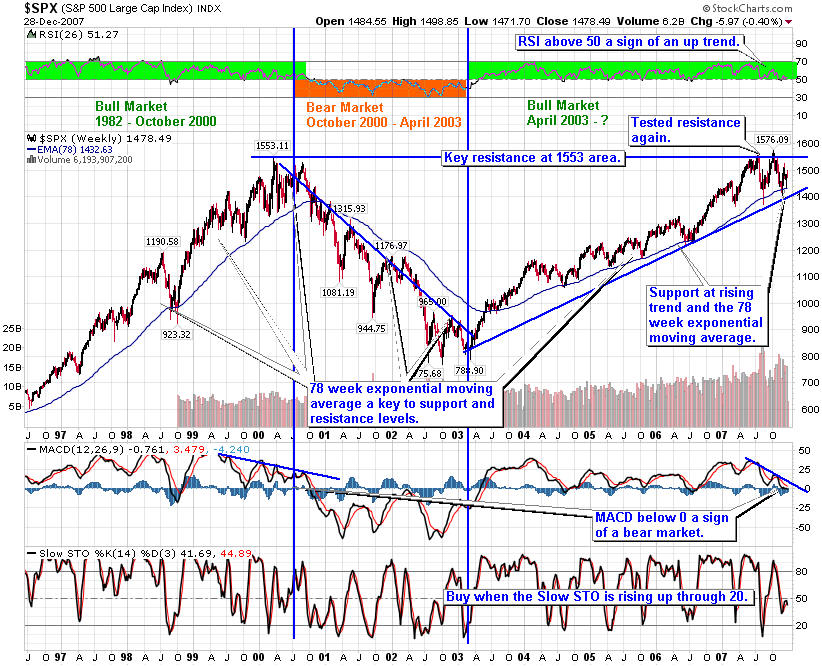
Let's start with the long term view of the S&P 500. The Relative Strength Index (RSI) seems to be a good indicator of the cyclical bull and bear markets. In addition, the 78 week Exponential Moving Average (EMA) acts as support.
We remain in a bull market as support at the rising trend line and the 78 EMA is holding. RSI is just above 50, however, MACD is just below zero. This indicates we could test support and if it fails we will be in a bear market. Watch 1400 area in particular. This would be consistent with the fundamentals of a weakening economy, possibly already in a recession. It is best to remain nimble during times like this.
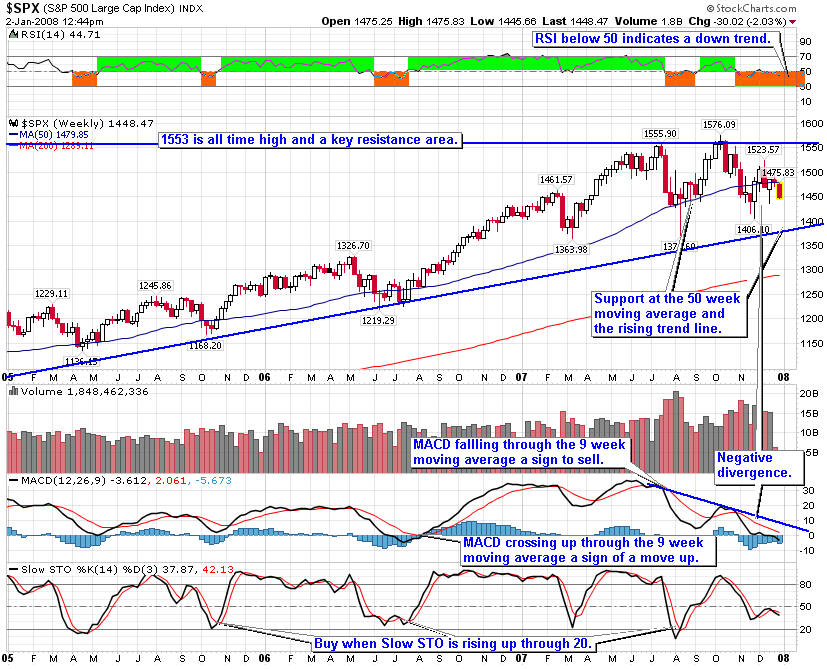
The weekly S&P 500 below is in a bullish ascending triangle. Support is the rising trend line. Notice how 1400 is a key level here as well. the 50 day moving average has acted as support in the past and is being tested now. If it fails this is another sign we are likely entering into a bear market. RSI below 50 indicates a down trend.
MACD broke down through the 9 week moving average, a sell sign. Also we see negative divergence on the MACD where the indicator shows a down trend and the price has not yet fallen. this is another sign that we are likely to see more weaknesses in the market in the near future.
As a result we should expect more market volatility over the next couple of months. Also, keep in mind that this is earnings season so expect some volatility as we get good and bad surprises from various companies. So far analysts have reduced earnings expectation from double digit growth to mid single digit growth. Not a good sign for a good earnings reports from companies.
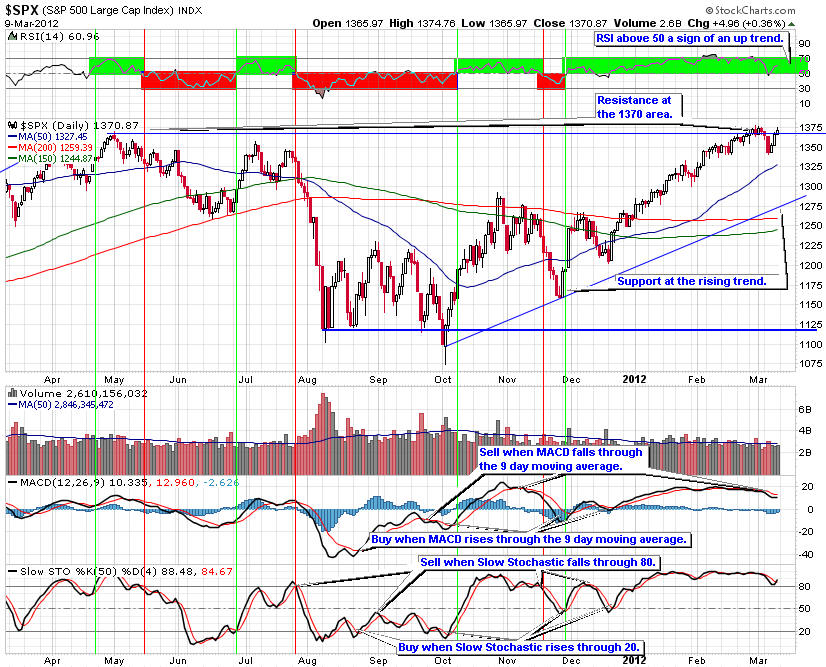
The daily S&P 500 chart lower highs as the index is unable to move higher, which is a negative sign. Support is at the all important 1400 level and then just below at 1380. If these fail, we will be in a bear market.
RSI is below 50 indicating down trend. The MACD gave a buy signal but is now turning down. For now it is best to be ready to go long if support holds or go short if it fails. In the mean time patience is the best way to go, unless you are a day trader.
Given this perspective, we are still in an up trend though we are testing important support levels. If they fail, we will be in a bear market. For now I am looking for good companies that are trading lower, especially those that have offer good value and growth opportunities. I also am looking for stocks that are trading near their key support levels. This pull back will present us with some very good buying opportunities if support holds. If not then I expect to go short to take advantage of the market's weaknesses.
Our Premium Members get to have access to many more charts on the market as well as economic analysis with the Weekly Market Update they receive every Sunday night. They also receive email messages of buy and sell ideas just before they happen as well as access to detailed stock analysis of all stocks on the Watch List. I also provide intraweek updates on important market action. If you are interested, request a membership with a four week free trial.