Buy low, sell high is a great idea for trading and investing. However, when is the price low and when is it high? Was Google high when it traded $200 per share three months after its IPO (Initial Public Offering), or was this a low? What about Cisco, the hot communications equipment company that went from $7 per share in 1996 to $80 per share in 2000 and then back to below $20. Along the way up it looked high at $30, $50, $70 and on the way down it looked low at $60, $40, and $20. There are many other stocks that look high on the way up and low on the way down. It is very hard to tell how high, high is and how low, low is.
The point is you cannot tell whether a stock is low or high. What you can do is assess what trend the stock is following. In other words, the "trend is your friend," another Wall Street axiom that is true. By following the trend up or down a trader can determine good entry and exit points as well as where to set the all important stop loss.
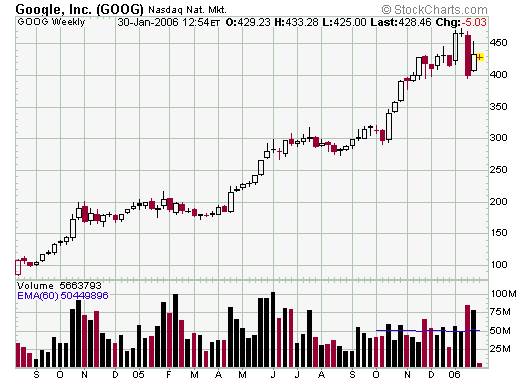
Take a look at the Google weekly chart below. Note the upward trend in the weekly share price. Also note the periods of consolidation such as from November 2004 through April 2005 when Google traded $160 per share and $220 per share. There are clear trends up and clear consolidation areas. A trader could use a chart like this noting the up trends and the consolidation areas to help make profitable trading decisions. Note that we never mention whether Google is at a low or a high nor do we need to know this. We will discuss much more on trends at later segments of Trader's Insights.
Trading stocks is a wonderful way to make a living. It also is a great way to loose everything you own. For every buyer who wants to own a stock there is a seller who no longer wants to own it. Winning as a trader requires discipline. This discipline is learned from doing your homework and from experience.